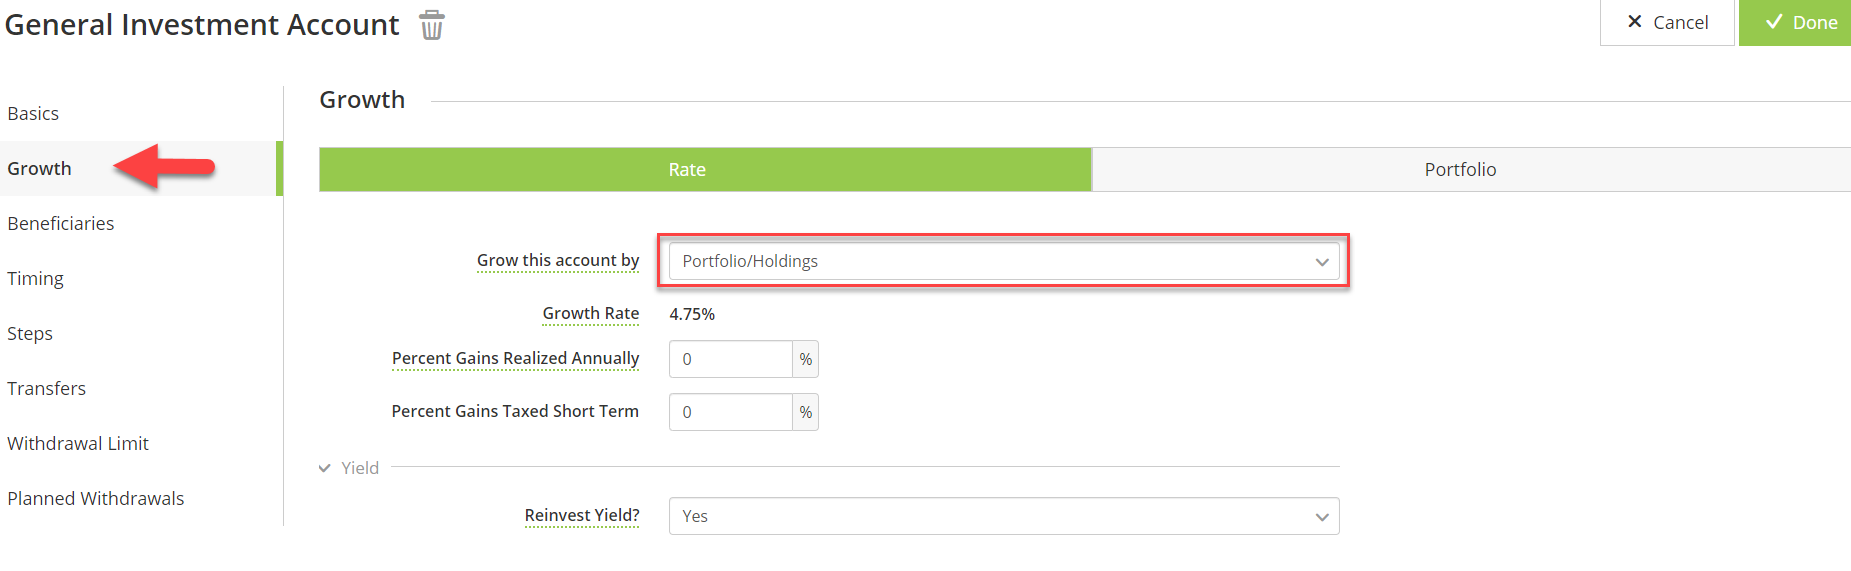
Grow this account by Portfolio/Holdings refers to how an investment is split by underlying asset classes. For example, we could define an investment as being made up of 70% UK Equity and 30% Fixed Interest.
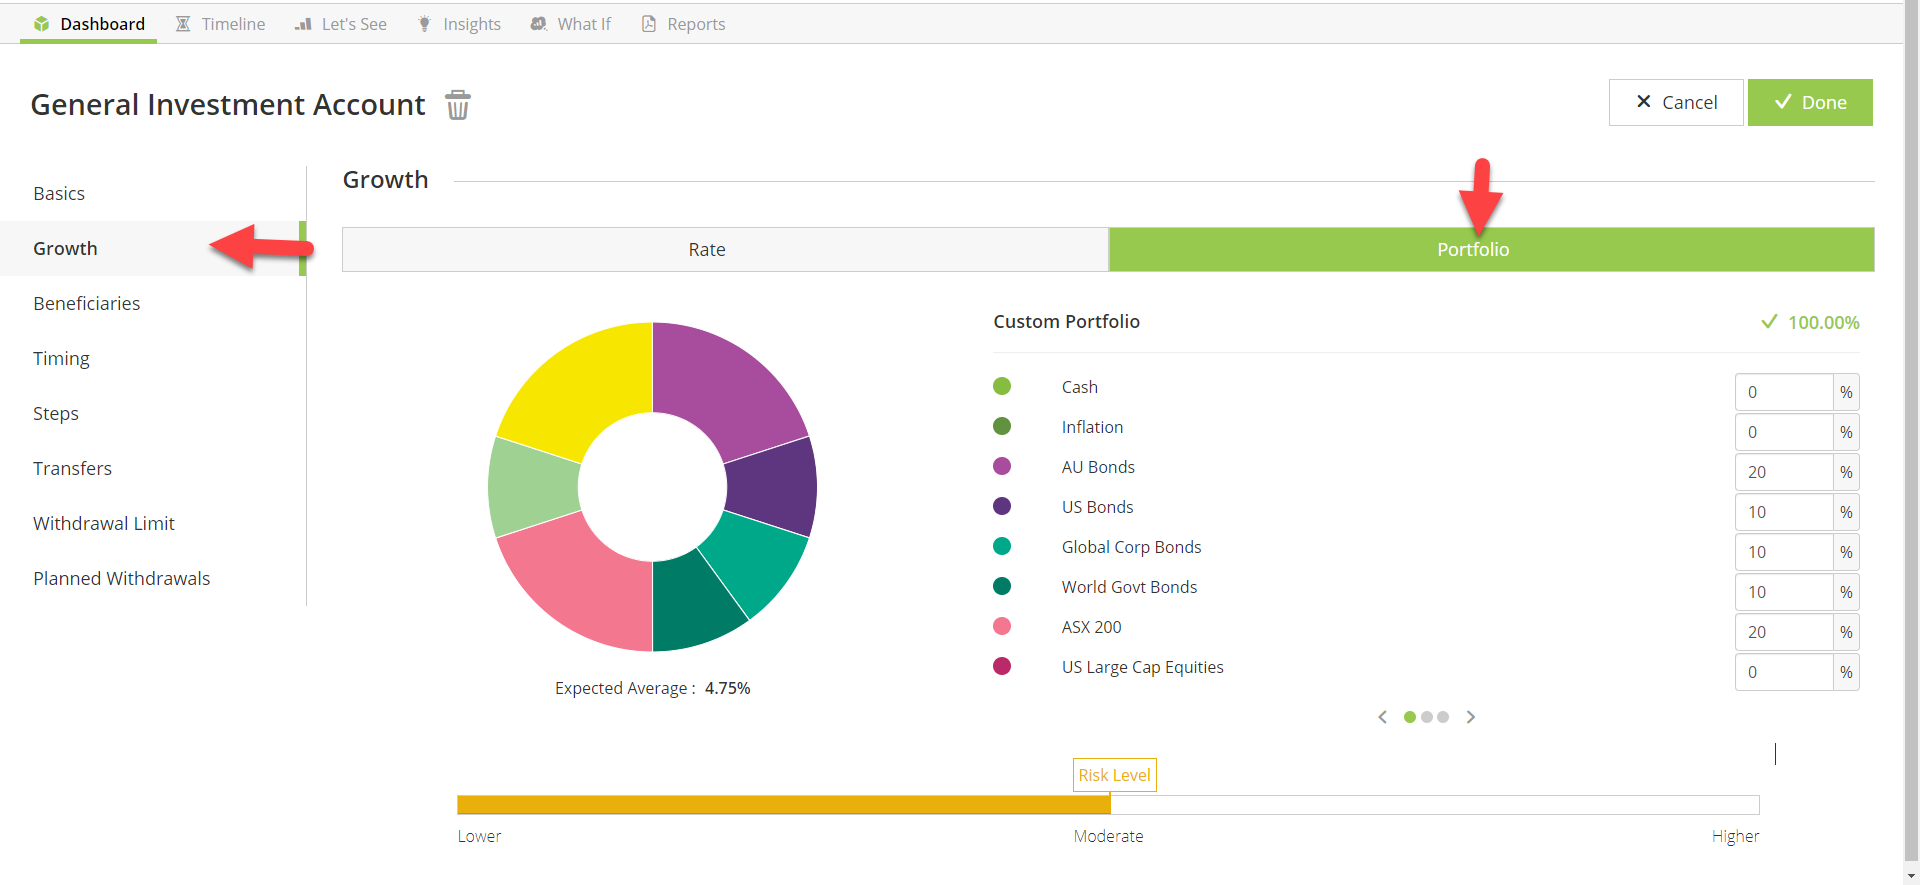
Portfolio/Holdings (and the market assumptions for each Asset class behind them) are one of two options for driving investment returns, within the software.
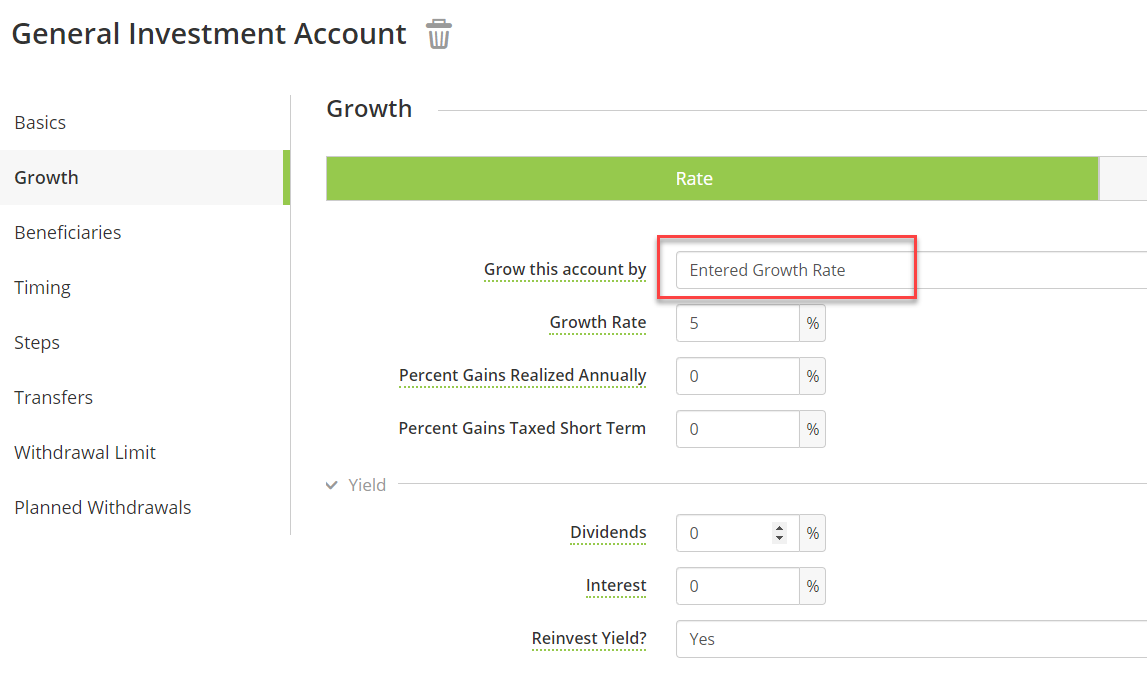
The other option is using a Entered Growth Rate, as illustrated below:
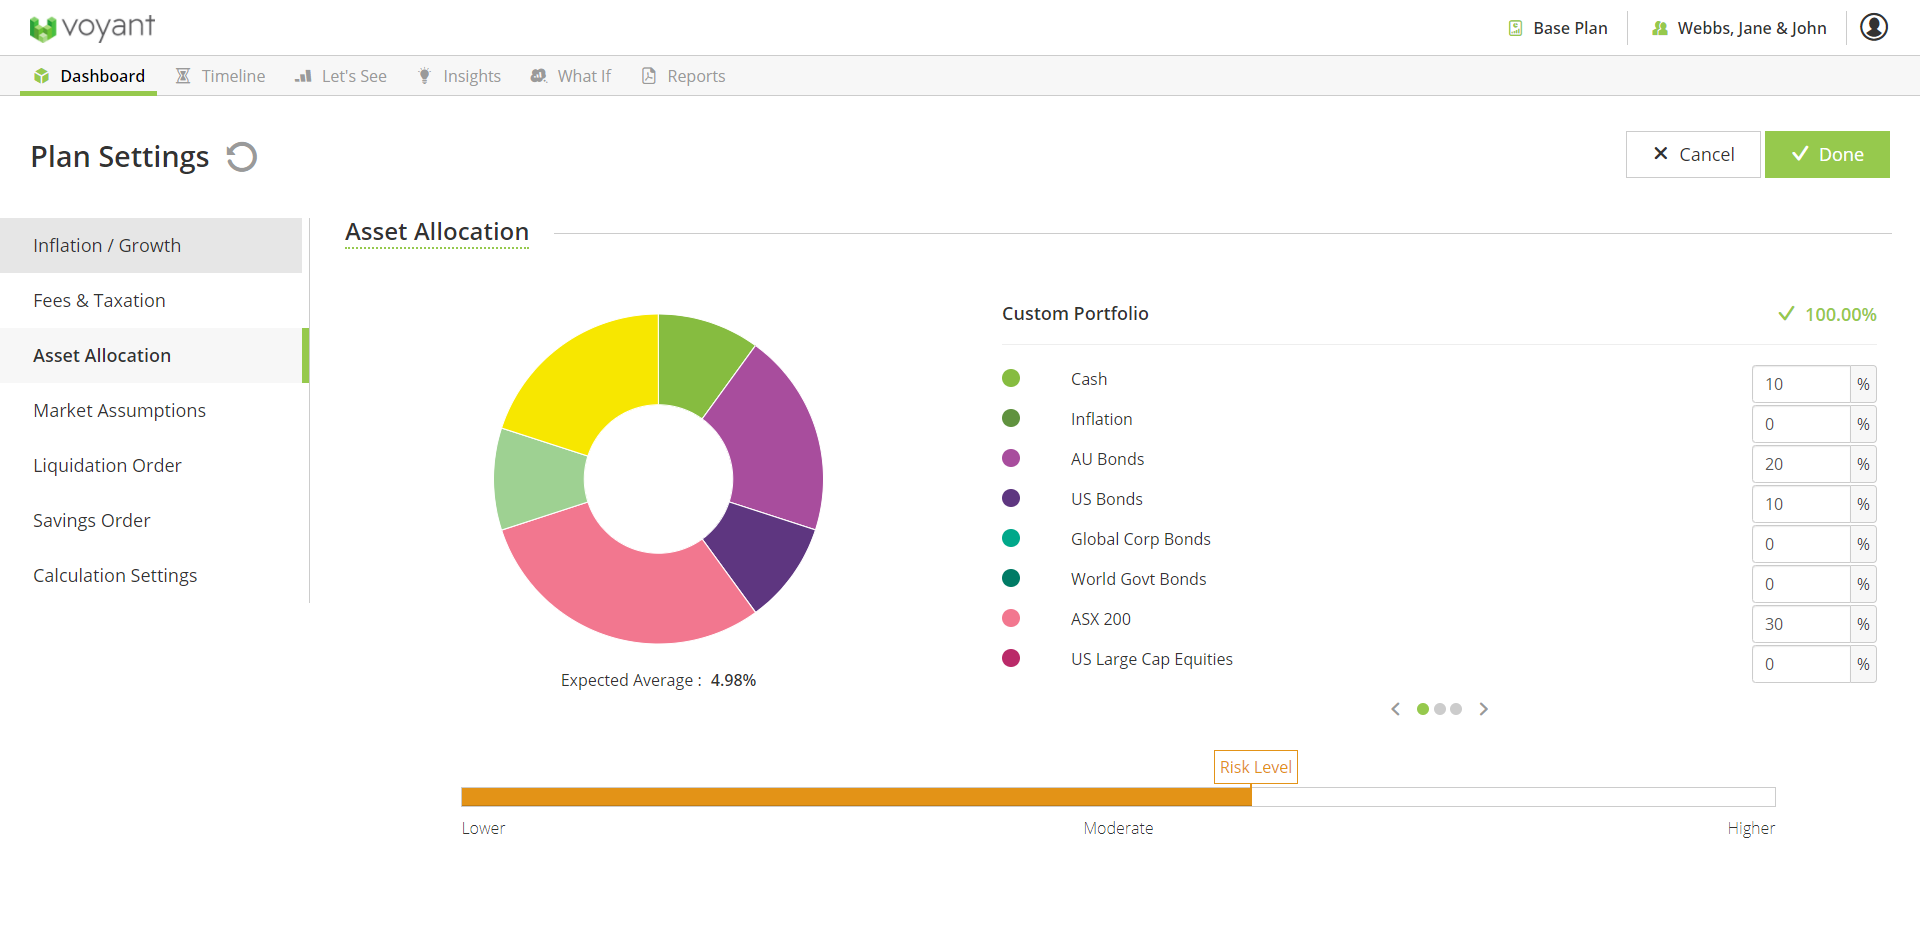
Set a default Portfolio up in Plan Settings - Asset Allocation. This means when you create a new Investment or Pension and set it to grow by Portfolio it will use this portfolio by default. You can change it for that individual account if need be.
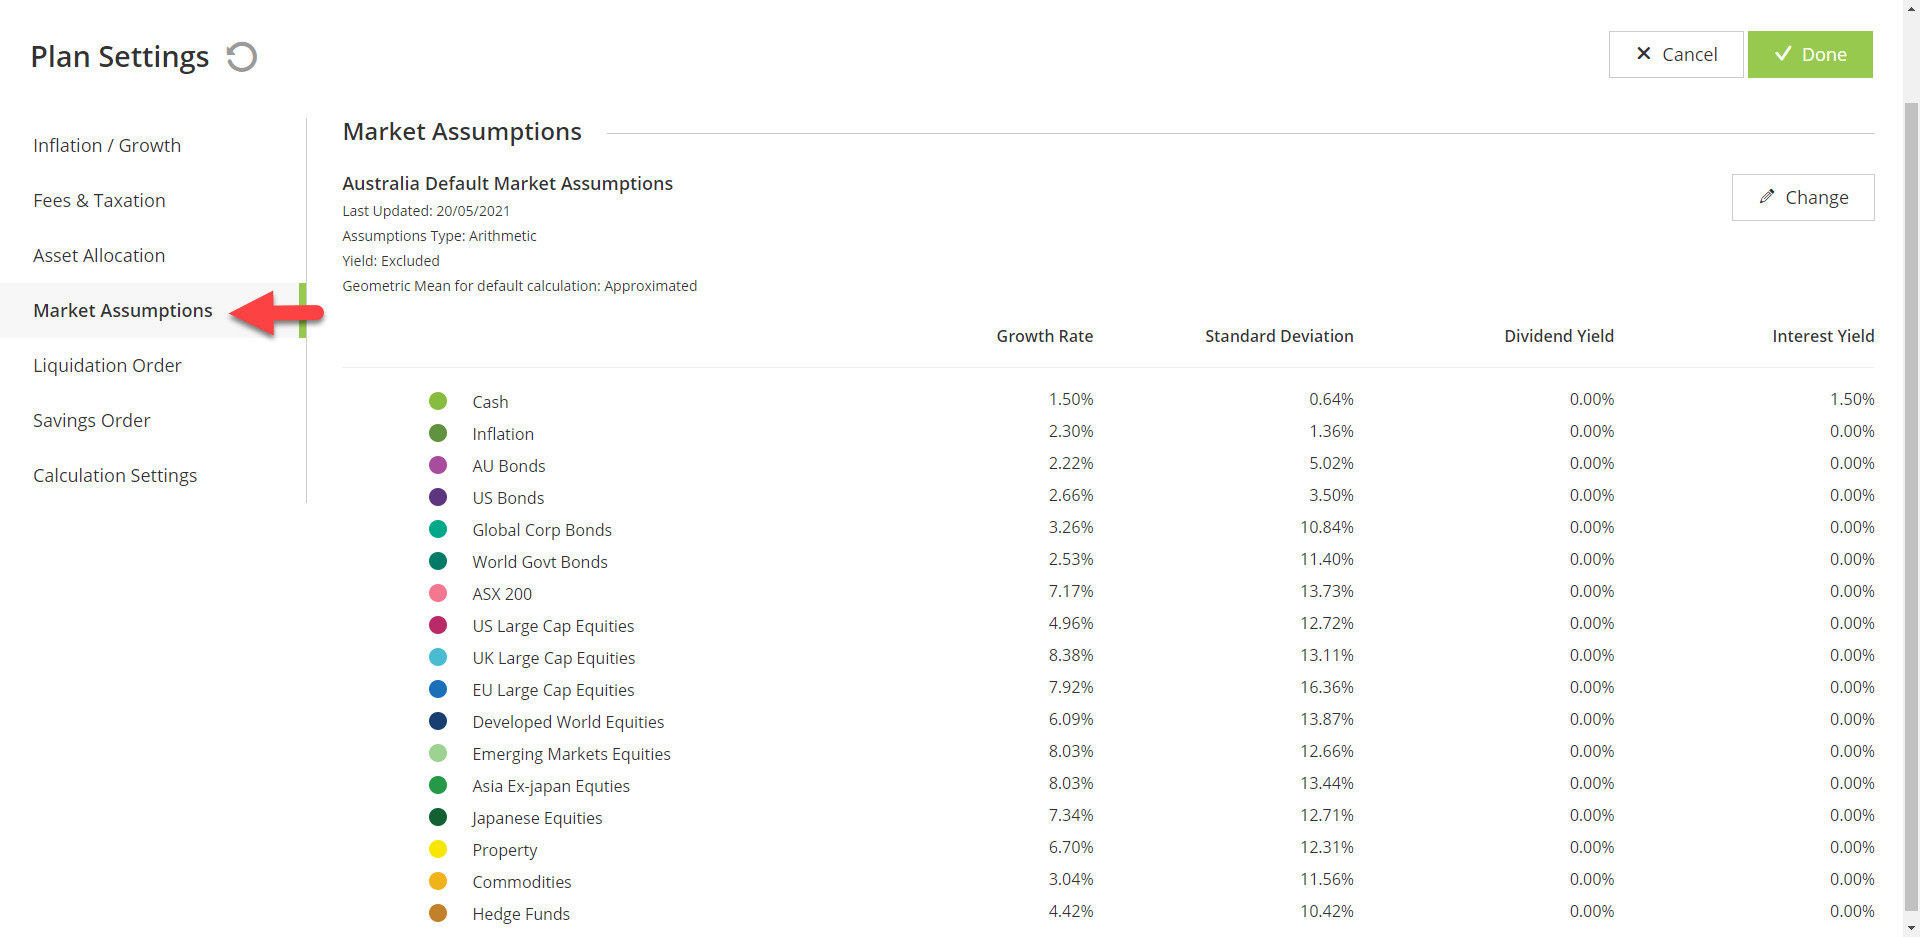
See the assumed Growth Rates, Standard deviations and Yields for each Asset Class in the Market Assumptions section of Plan Settings (from Dashboard). Note you can change these if you have a Rebrand. See this guide for more information: Rebranding - About Voyant's rebranding (white labeling) service
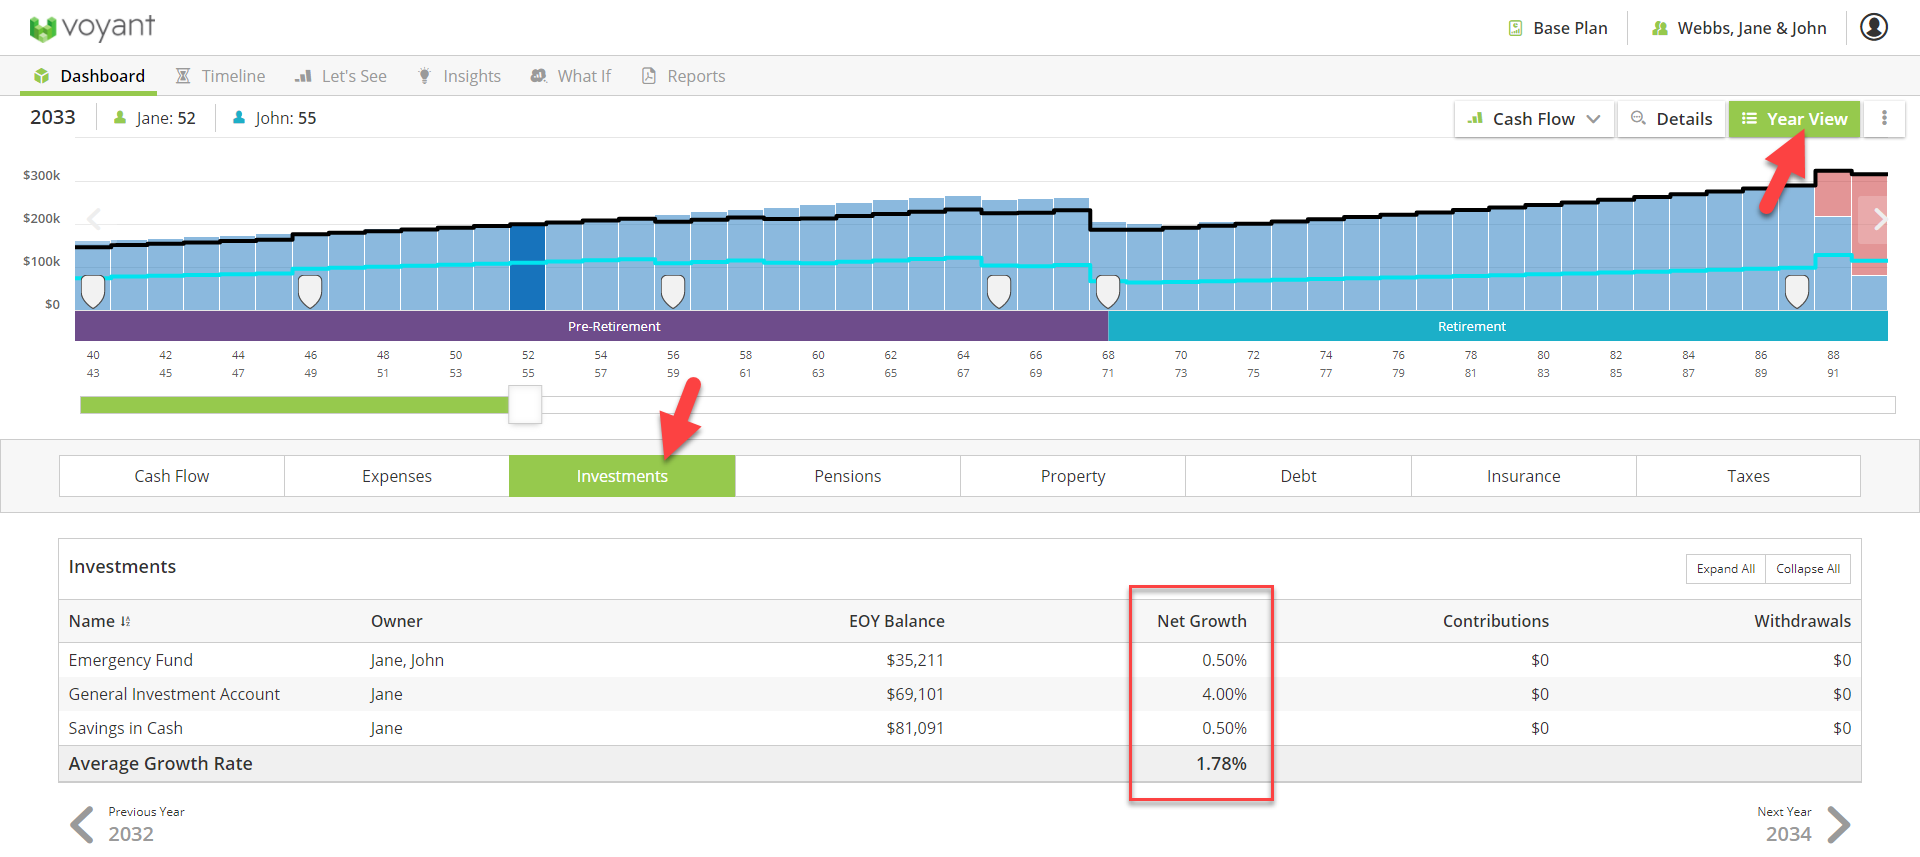
Check Net Growth rates by going to Year View - Investments or Pensions tabs and see the Net Growth column. Click on the account name to view more information, such as Gross growth rate and Fees.
Unlike an entered growth rate, which is entirely deterministic, asset allocations permit of a range of possible returns. For normal purposes, however, the software's assumed investment return (for any given asset allocation) will correspond to the 50th percentile return (i.e. the 'mean' return). This 'mean' return will, typically, be the weighted average of the individual asset classes within the portfolio.
The use of Portfolio/Holdings will come into play for certain Insights and Special Events, such as the Major Loss Event and Performance Insight. In fact some of the market-based functionality within the software requires that at least one, or more accounts are to be grown using asset allocations, in order to be used. These features include the Monte Carlo and Historic simulations.
The software will also calculate an upside and downside range of likely returns (for a given portfolio), with each value being two standard deviations from the 50th percentile. This range of return can also be equated to a level of risk. Also note that the estimated maximum upside, and downside for a given asset allocation (i.e. portfolio) will take account of the assumed correlations between the asset classes of which the portfolio is made up, i.e. a portfolio that comprises negatively-correlated asset classes will have a lower potential upside, as well as less potential downside.
This means for example that a Portfolio with mostly bonds will have a different market crash drop than a portfolio comprised of mostly equities. This is compared to using Entered Growth Rate which will drop the growth rate in that year by a fixed percentage instead (regardless of the composition of the investment, as this has not been entered into the system).