Chart Selection
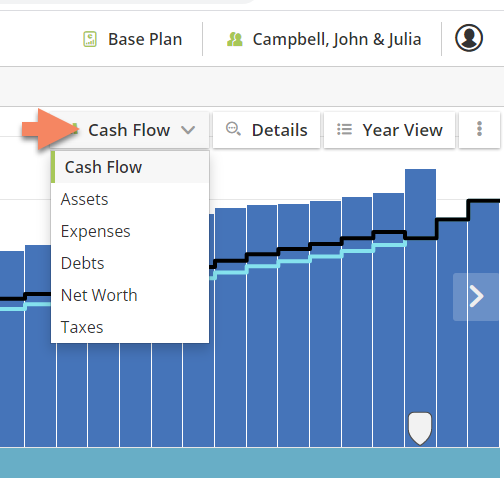
Chart selection has been made quicker and more intuitive via a drop-down menu, pictured below.
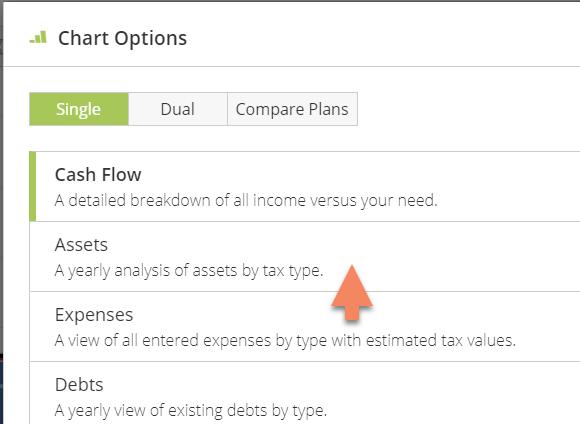
Currently, navigation between charts involves clicking the chart name and then making your selection in a pop-up dialogue, as pictured below.
Switching Between Chart Views
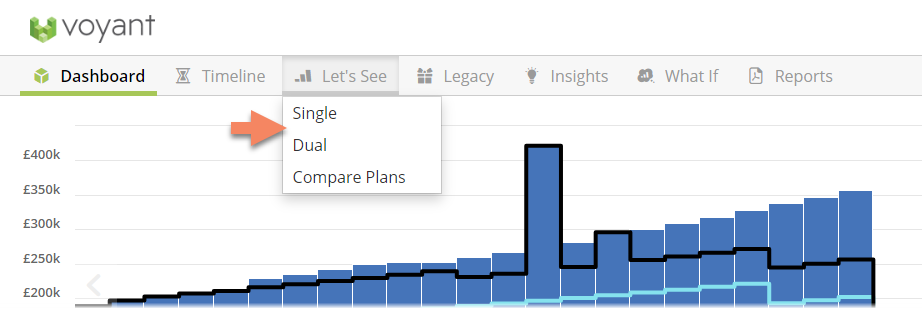
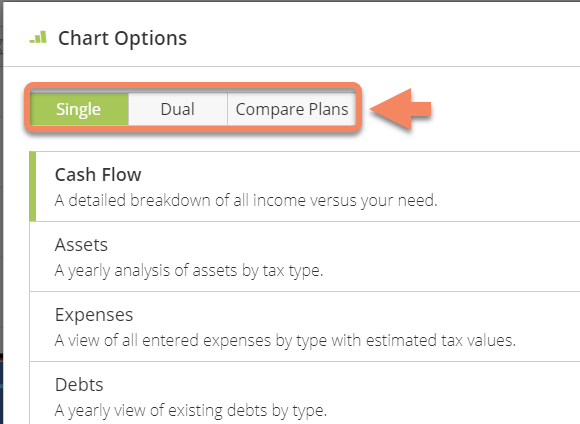
Moving between the three chart views – Single chart, Dual chart, and Compare Plans – has also been made more readily accessible and intuitive. Switching from a single chart view, the software’s default, to a dual chart or compare plans view is now done via a drop-down menu under Let’s See in the top-level navigation. Select Let’s See and you will be prompted immediately to select one of these three viewing modes.
Currently, switching between the three chart views involves clicking the chart name and then making your selection in a pop-up dialogue, as pictured below. These alternative chart views are relatively hidden.

Labeling the Chart Details and Year View Buttons
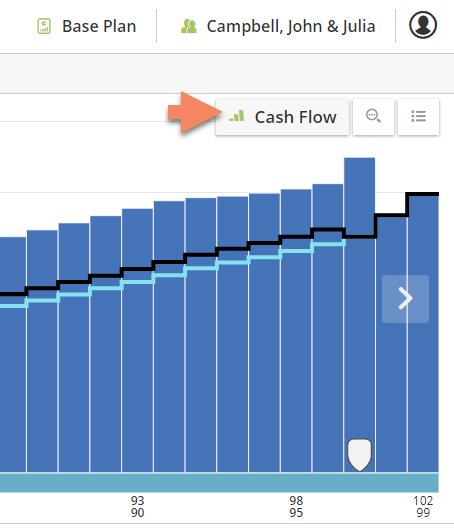
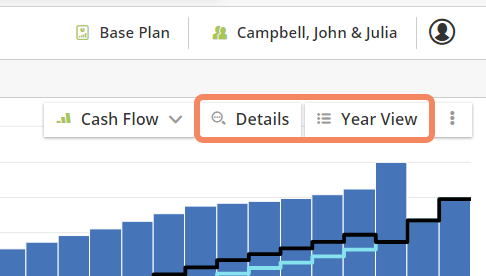
The Details button, which toggles the detailed view of the charts on and off, and the Year View button, which switches from the charts to a view of the annual calculation details behind them, are now labelled, as pictured right. This subtle change should make navigation more intuitive and the function of these button less ambiguous to first time users.
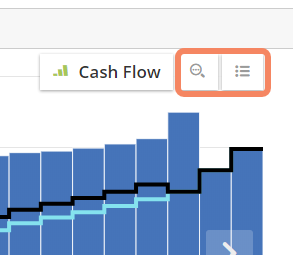
Currently, these buttons are not labeled, as pictured below, and have no tool tip to tell users what they do. Users must discover what these buttons do usually with a click.
New “More Features” Menu
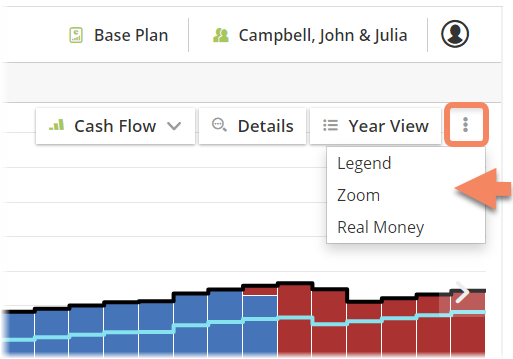
A vertical ellipsis button has been added to the chart navigation as a place to store special, ancillary chart features such as the Real Money view as well new chart zoom options, which we will discuss in a moment, and the new option to toggle on or off the chart legend.
The special chart features on this menu can be selected or deselected to be toggled on or off.
This menu has been positioned to host additional new chart features as we add them.
Watch an Introduction to These New Features
Highlights from the August 2020 Release
New animation for loading the Let's See charts
New chart zoom tools - zoom in or out to change scale and focus on selected stages and timespans
An example of the redesigned charts in action
Read the Full August 2020 Release Announcement
View or download a complete guide to these new Let's See chart features in our August 2020 release.
Further Reading and Related Topics
Experiencing problems viewing the new charts? Here are two tips for clearing your browser cache.
How to do hard page refresh in Chrome, Firefox, Safari and Microsoft Edge
How to clear browser cache in Chrome, Firefox, Safari and Microsoft Edge